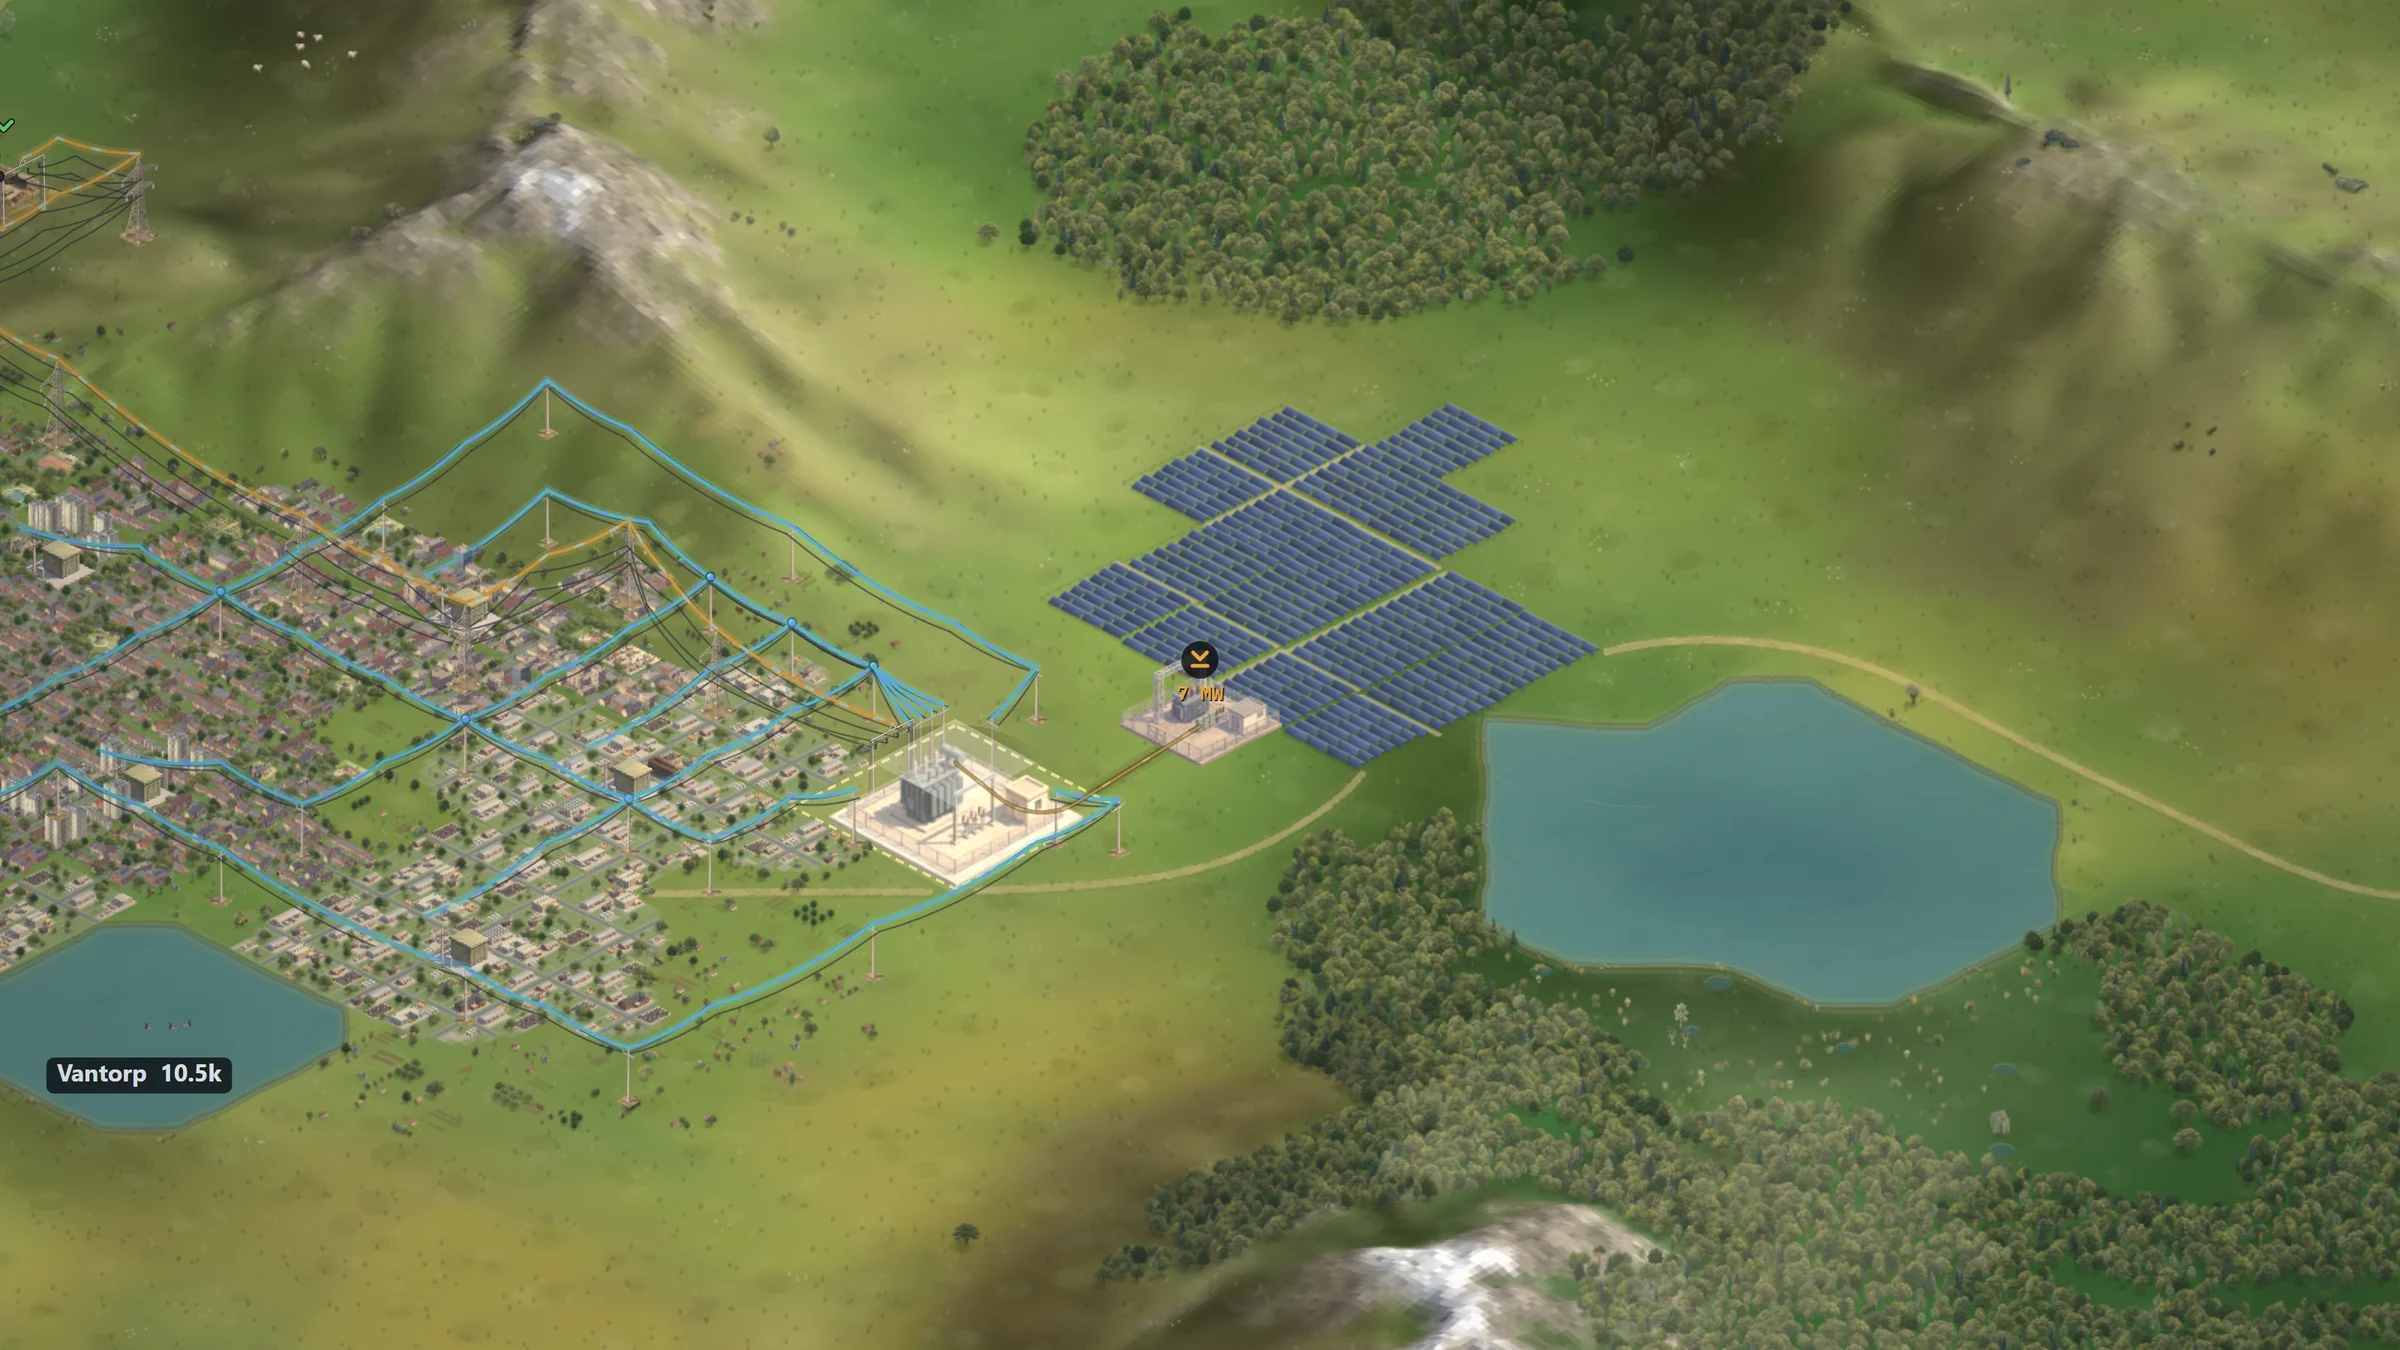
Draw Your Solar Parks
Solar parks are now drawn on the map, tile by tile. You see what each tile costs while you draw, and each park connects to the grid at one point on its edge.
Draw a park tile by tile
A solar park was a square of four tiles. Now you draw it. Select the Solar Park on the build bar and click the tiles that it is to cover. Hold Shift and drag to draw a rectangle. A plain drag still moves the map.
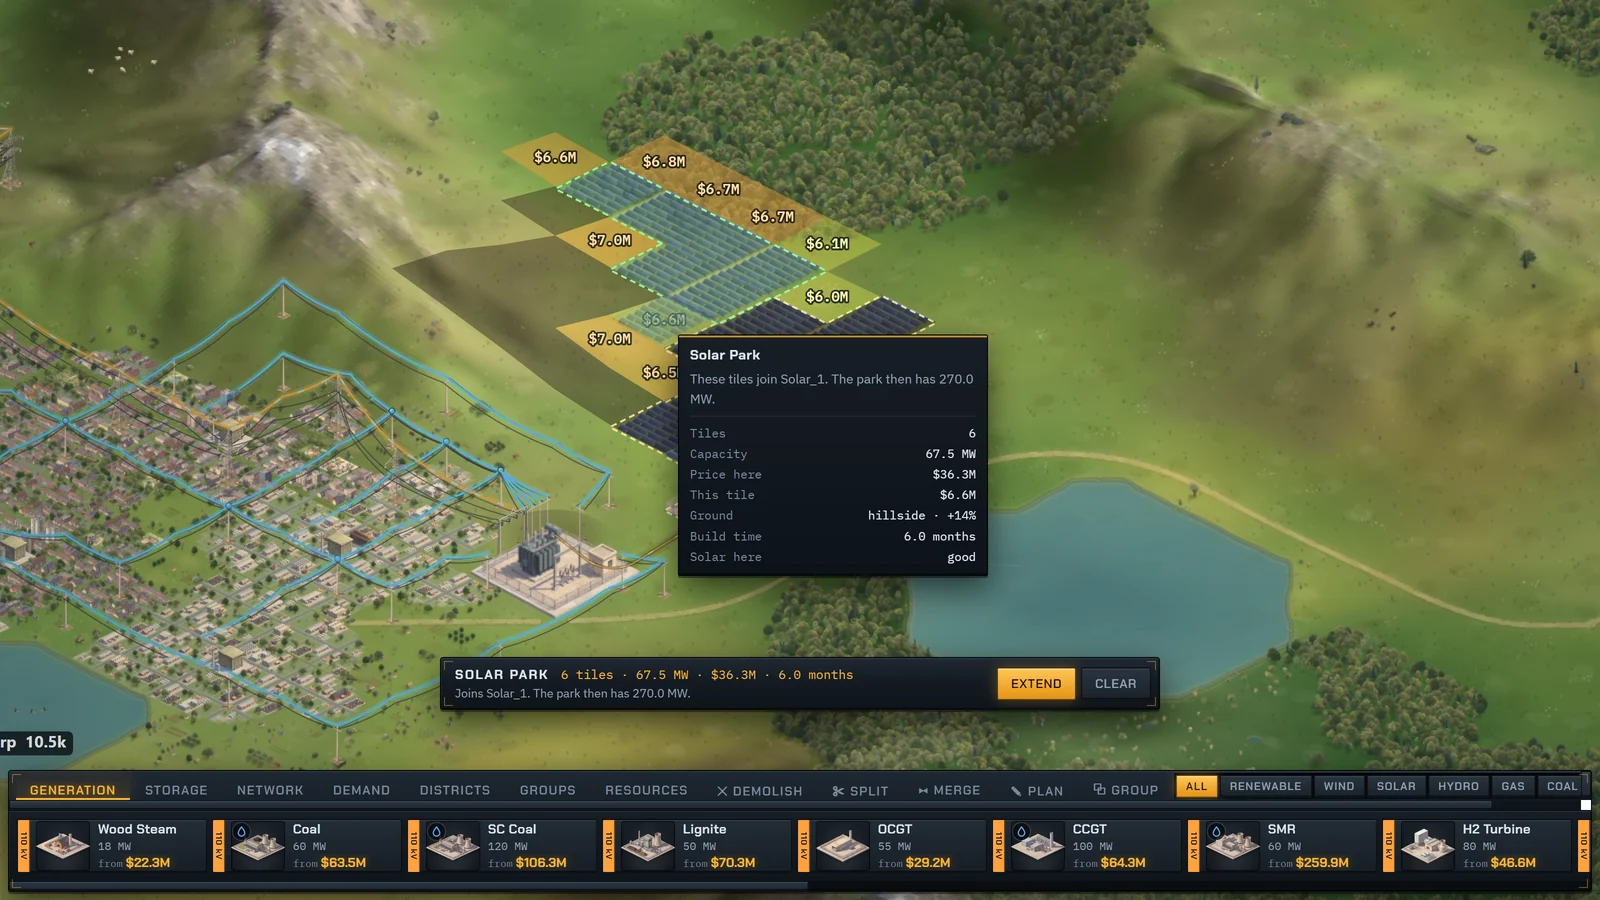
While you draw, the tiles near the pointer show what they cost. Open grass is cheap. Forest, towns and hills cost more, so a park can go round them.
- Press Enter, or Build on the bar, to order the park. Backspace or Ctrl+Z takes back the last tile.
- A park can have up to 64 tiles. Each tile of fixed panels gives 11.25 MW.
- To make a park bigger, draw onto it. This works for the square parks of older colonies too.
- The Plan tool draws solar parks into a project, like any other building.
One point to connect
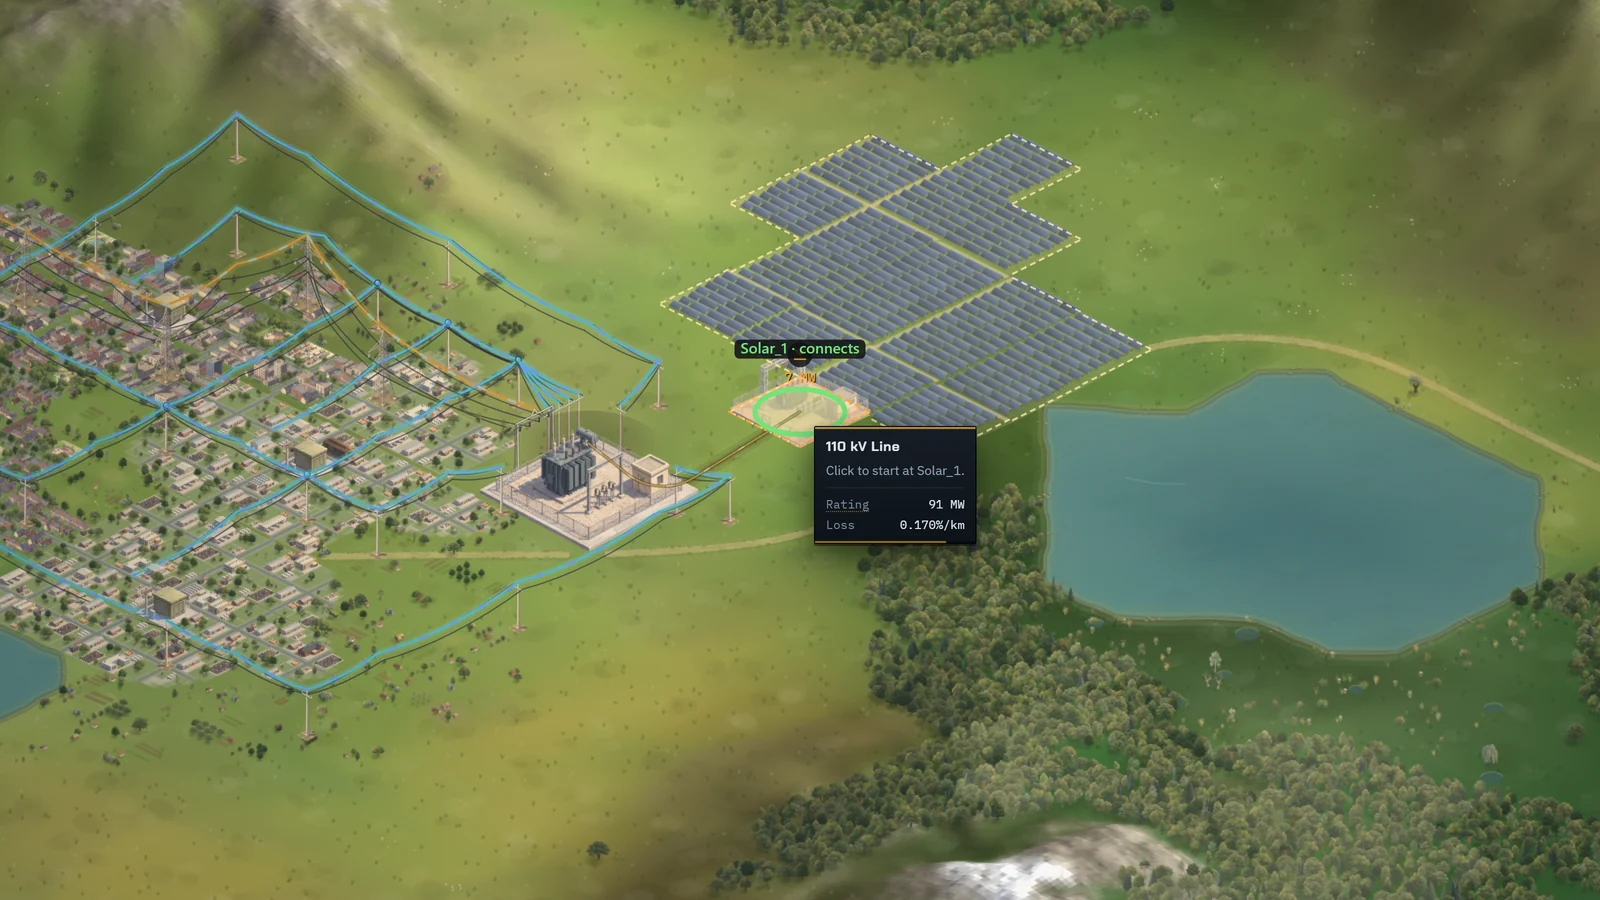
Each drawn park connects to the grid at one point: a small yard with a transformer, on the edge of the park.
When a line tool is selected, the yard has a ring in the colour of the line. End the line there.
- The first tile that you draw is the point. Alt-click another tile on the edge to move it.
- When you make the park bigger, the point stays where it is.
Line loads from far away
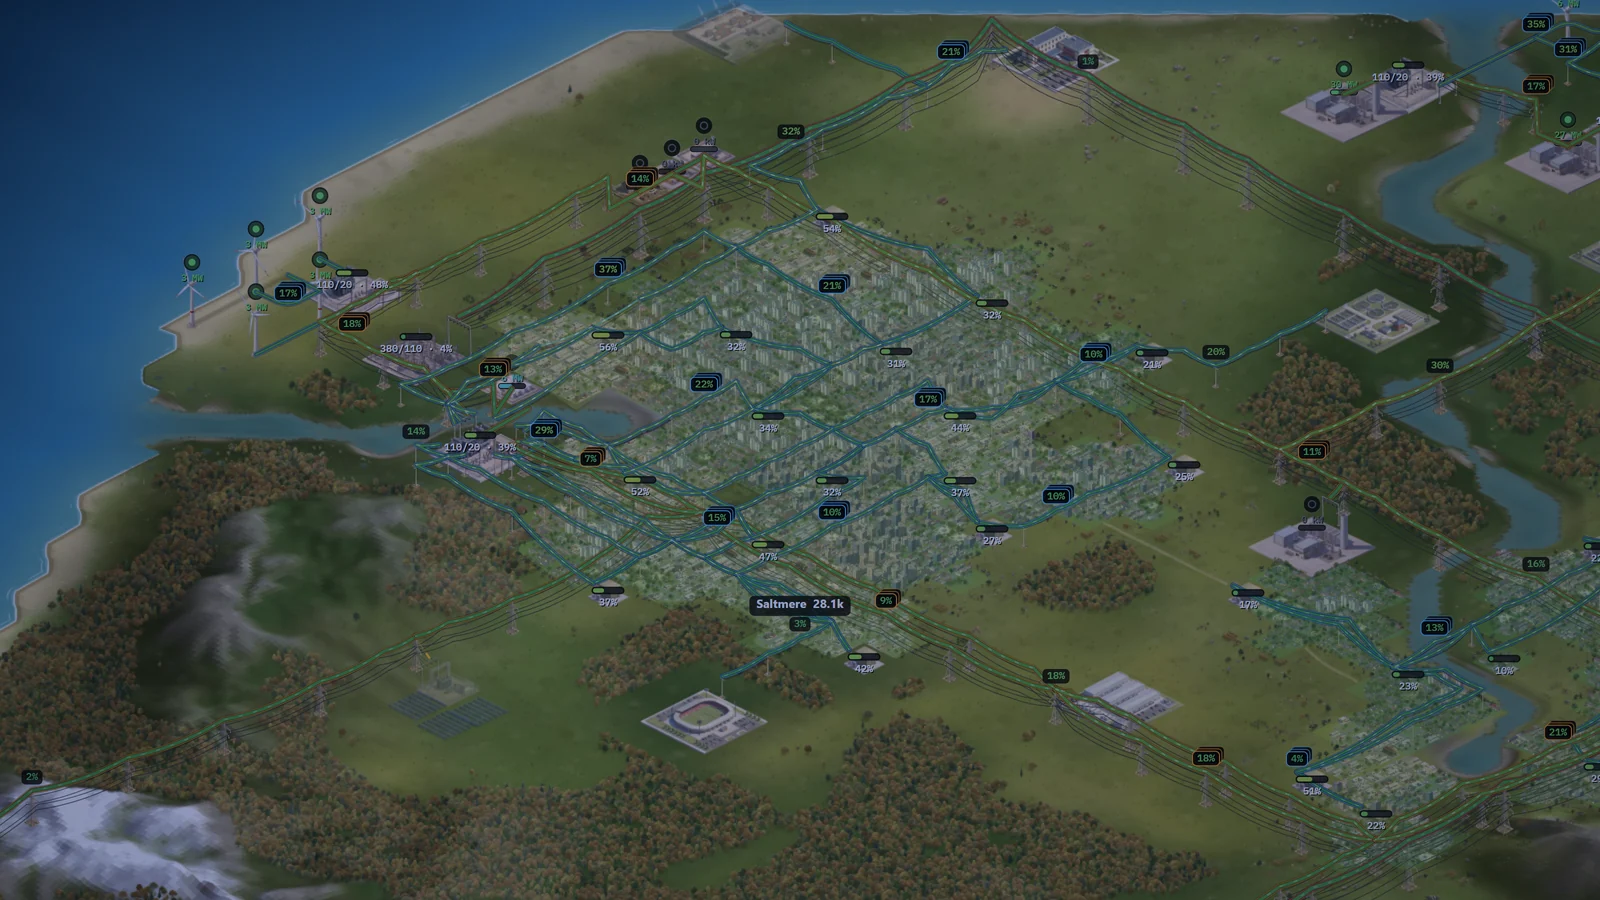
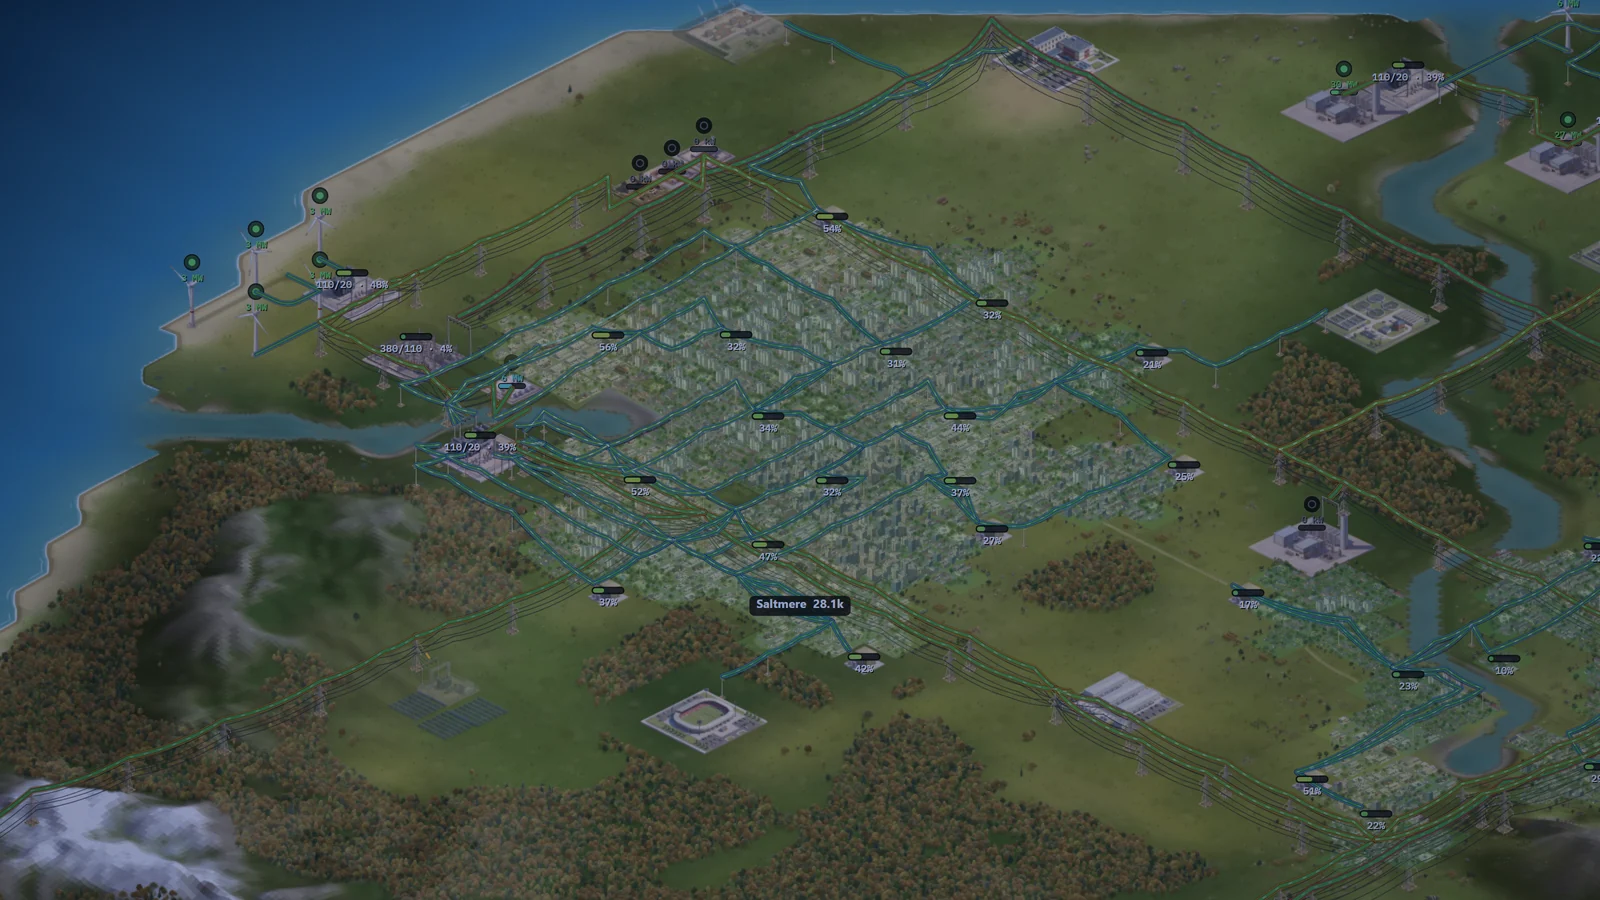
Before, a line with low load lost its figure when you zoomed out on Network Load. Now nearby lines of one voltage share one figure: their total load against their total rating.
A shared figure is a stack of badges, with an edge in the colour of the voltage. The figure of one line is one badge, with no stack.
The same view on both releases. Drag across the picture to wipe between them.
- A line at 50% load or more keeps its own figure.
- Point at a line to see its own figure.
- Every line shows its own figure one zoom step further out than before.
A Build Cost layer
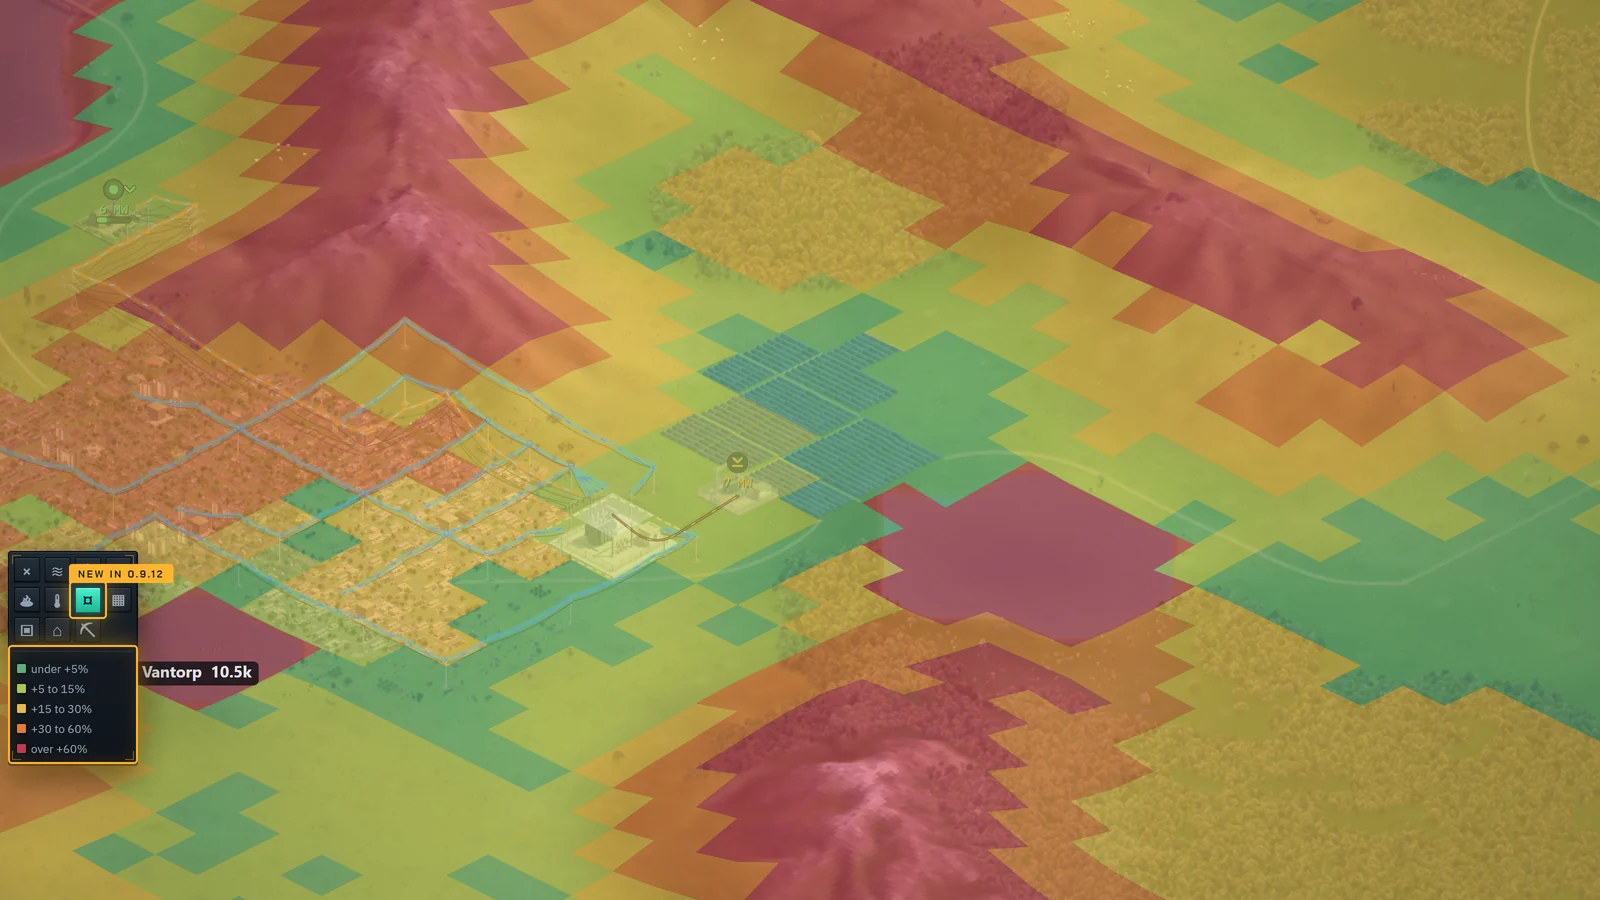
A new map layer shows what the ground adds to the price on each tile. It is the same figure that the build tools charge.
Plains and grass add nothing. Farmland, forest, towns, marsh and hills add more. On water, the colour shows what a line pays to cross.
- Point at a tile to see its exact figure.
- Press Q or E to go through the map layers.
Upgrade all selected
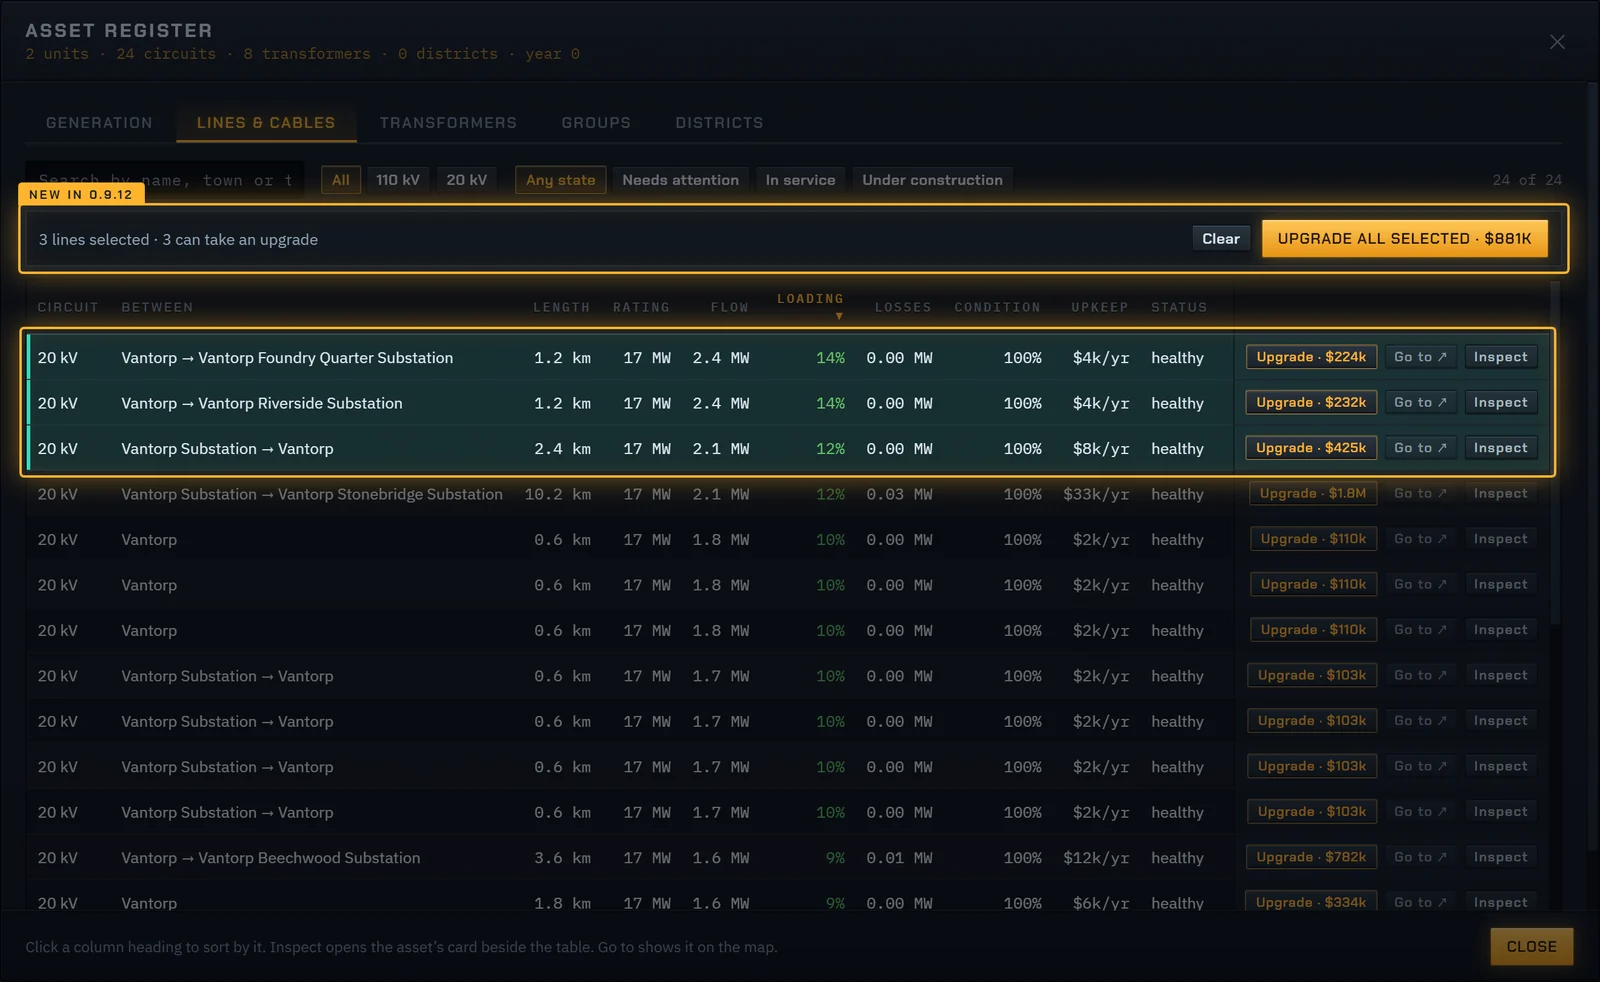
On the Assets screen, hold Shift and click rows to select lines and substations. The strip over the table shows how many of them can take an upgrade, and what the upgrades cost together. Upgrade all selected orders all of them.
It comes with Framework Contracts, a new development at the end of the tree. Before that, the strip is greyed out and names the development.
- Each upgrade costs and takes the same as on its card.
- You can select lines on the Lines & cables tab and substations on the Transformers tab, then order them together.
Pick up a tool with Z
Point at a building or a line on the map and press Z. The build tool for it opens, at the same type. A substation keeps its size.
- Over open ground, Z puts the tool down.
- With Ctrl, Z still takes back your last change.
- Built in the wrong place? For 5 seconds after the order, the card of the new building or line offers Take back, for the whole price.
More in this update
A few more changes, in short. The full list is under this post.
- The Hydro Potential layer shows weak, fair and strong river reaches in clearly different colours.
- The Challenge card counts down the days that are left on its map.
- The figures in the top bar open their screens.
- The price tooltip and the Finance screen show your break-even price.
- New colonies start tighter, with a first power station that fits the first peak.
- The Operating policy screen greys out what your colony cannot use yet.
- Large colonies with dams and solar towers no longer slow down.
Everything in 0.9.12
Every change in this update, as it is listed on the changelog.
- Solar parks are now drawn on the map tile by tile, up to 64 tiles, round woods, hills and water.
- Each drawn park connects to the grid at one point on its edge. Alt-click a tile to move it there.
- While you draw a park, the tiles near the pointer show what they cost and what the ground adds.
- To make a park bigger, draw onto it. This works for the square parks of older colonies too.
- The Plan tool draws solar parks into a project, like any other building.
- When you zoom out on Network Load, nearby lines with low load share one stacked figure instead of showing none.
- New map layer, Build Cost: what the ground adds to the price of a building or a line on each tile.
- Shift-click lines and substations on the Assets screen, then Upgrade all selected orders all their upgrades at once.
- New development at the end of the tree, Framework Contracts, opens Upgrade all selected. Before that, it is greyed out.
- Press Z over a building or a line to pick up its build tool, at the same type and size.
- For 5 seconds after an order, the card of the new building or line offers Take back, for the whole price.
- The Challenge card counts down the days that are left on its map.
- The figures in the top bar open their screens: Finance, Cities and Emissions.
- The price tooltip and the Finance screen show your break-even price: the price that covers your costs.
- On Network Load, every line shows its own figure one zoom step further out than before.
- The Hydro Potential layer shows weak, fair and strong river reaches in clearly different colours.
- The card for a year with a loss explains the loss from that year’s own figures, fines included.
- New colonies start tighter. The first power station fits the first peak, and a second town comes in year 1 or 2.
- The Operating policy screen greys out what your colony cannot use yet, and names the development that brings it.
- On the Finance screen, fuels that no unit of yours burns yet are greyed out.
- Development opens with the chosen programme in view, also in the last stages.
- The pricing page lists what each edition unlocks and how the harder worlds open.
- The website has a new glossary page with every term of the game.
- Colonies saved before 0.9.12 load as they are. A colony saved in 0.9.12 does not open in an older version.
- Large colonies with dams and solar towers no longer slow down in their later decades.
- In the lesson, the camera no longer jumps from step to step. It glides.
- The Hydro Potential hint no longer says that a dam needs a drop in height. Only river flow counts.
Play 0.9.12 now
No account and nothing to install. Your run is saved in your browser.